Rules Change, Average Proximity, Pit Stops, and Broadcasting
Rules Change
Last Tuesday, Shams Charania reported that the NBA is planning to change the rules related to how players draw offensive fouls. Often, a player will launch his body/leg into the defender while shooting, which results in free throws when deemed a defensive foul. Beginning next season, it is likely these maneuvers will be officiated as offensive fouls, according to Charania.
Faced with the threat of committing an offensive foul, players will stop trying to draw fouls this way. Undoubtedly, the rules change should speed up NBA games by reducing stoppages for fouls and free throws. I am happy about that, but let’s focus on a different impact: scoring.
When a player draws a foul while shooting, he gets to shoot free throws. Free throws are efficient shots, meaning they will result in more points than an average possession is expected to produce. Additionally, any time a defensive foul is called, there is an increase in the probability that a team will go into the bonus, which results in more free throws. Effectively, any time a defensive foul is called, the expected points per possession of future possessions should marginally increase. By eliminating defensive fouls on shooting attempts via this rule change, scoring in the NBA should decrease next season, all else held constant. Many rules changes have negligible impact on scoring; my intuition is that this change will be impactful.
For people who create sophisticated NBA models (NBA front offices, professional gamblers, etc.), alarms bells should be sounding. Update your models!
Imagine that you are a professional gambler who specializes in betting on how many points will be scored in NBA games. A few years from now, you write some logic to answer a question like, “Over the last five years (2019-2023), how many points per game were scored amongst teams who play at a fast pace?”
If a rules change that went effective for the 2022 season decreases scoring, a modeler must account for that. Otherwise, you will blend data from before and after an impactful rules change. Without controlling for the points decrease from the rules change, you will predict forward-looking scoring totals that are too high.
I can assure you that intelligent NBA modelers will be monitoring the impact of the upcoming rules change on their models. The same concept applies for other sports. When the NFL moved extra point attempts back 15 yards, attempting a two-point conversion increased in relative value (because a team is more likely to miss the extra point kick), even if marginally.
Intelligently modeling a sport across time requires paying attention to rules changes. I am eager to see the impact of the NBA’s rules change next season both at the macro level (“How many points per game are scored across the league?”) and micro level (“How many points per possession does Trae Young score?”).
Average Proximity to the Hole
A familiar phenomenon, some bad information circulated around the Golf Social Media-Sphere last week. Since some of the sport’s most trusted stats voices (*eyeroll*) amplified the information, I will address why the message was misleading.
In golf, there’s a popular notion that players should be more conservative with how they aim at targets. The argument is along the lines of, “Stop aiming at flags from long distances, you will score better picking less aggressive targets and prioritizing finding the green.” While there is some legitimacy to this statement, it can lead to fundamentally incorrect conclusions. I responded to one of those bad conclusions below:


Because I value my sanity, I did not provide a Twitter explanation for why the “stats pros” circulating this tweet are misinterpreting the information, so I will provide the explanation now.
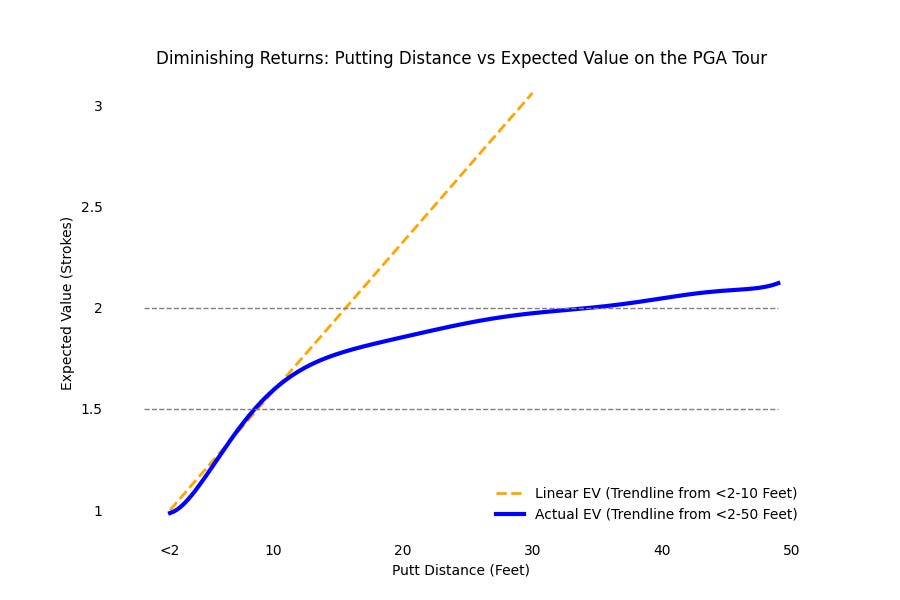
The tweet about Jon Rahm, winner of the U.S. Open, reads that while he claimed to be firing at flags and taking aggressive targets, Rahm averaged hitting shots to about 27 feet per hole in his final round en route to victory. If your conclusion is, “It’s hard to hit shots close to the hole consistently, even for the best players in the world”, fair conclusion. On the other hand, if you conclude that hitting shots to 27 feet consistently is a recipe for winning a golf tournament, bad conclusion. The following chart (it’s ok if you struggle to interpret it) illustrates why:
The probability of making a putt is nonlinear. In other words, there is a big difference in your chance of making a 5-foot putt versus a 6-foot putt, but there is a much smaller difference in your chance of making a 27-foot putt versus a 28-foot putt. As you get close to the hole (left side of the visual), your chance of making a putt increases rapidly.
Using the figures from the Jon Rahm tweet, Rahm hit shots to 47.6 feet and 8.7 feet on holes #12 and #14 respectively, which produces an average (~28ft) that is close to the average proximity cited for his round in the tweet. Would Rahm prefer to hit approaches to 47.6 feet and 8.7 feet or two approaches to 28 feet?
The answer is the former, as two shots to 8.7 feet (Expected Score = 1.55) and 47.6 feet (Expected Score = 2.09) will outperform two shots to 28 feet (Expected Score = 1.95) by 0.26 strokes, more than a quarter of a shot ( 1.55 + 2.09 - 1.95*2).
Even though the average is identical, a shot close to the hole and one farther away from the hole will outperform two shots in the middle. So the next time you hear a broadcaster cite “Average Proximity to the Hole”, think about this concept and how it fails to illustrate the full picture.
Pit Stops
A loyal reader sent me (always encouraged) this video, which discusses fundamental factors in deciding when to pit stop and change tires in a Formula 1 race. I liked the following graphic:
This graphic illustrates the benefit of changing tires. With each lap (as you move right on the graph), drivers lose speed as their tires wear down. The downside of pitting is that the driver loses about 24 seconds to other drivers per pit stop.
Formula 1 teams must determine the optimal time for a pit stop while factoring in the status of their own car and their competitors’ cars. Surely there are other relevant factors as well; the above graphic probably looks different for each race track, for example. Or perhaps if you can predict how congested the track will be at different times throughout the race, you can strategize pit stops to avoid high congestion.
The decision is a complicated intersection of physics and game theory, which is probably a fun, high-stakes modeling exercise. Smart decisions at the margin determine wins and losses, especially since races can be decided by milliseconds. Presumably these teams are investing quite a bit of money into finding an edge!
I almost titled this section Critical Race Theory to get some clicks, but I lacked the courage.
Broadcasting
I was reading a translated text on a flight last week and encountered the following line from the translator about the responsibility of translating:
“It is least of all his function to render the work palatable to those who do not wish, or are unable, to expend the effort requisite to preface the study of difficult texts.” - Allen Bloom
Because my brain is corrupted entirely, I was thinking about the appropriateness of this line as an analogy for broadcasting. People do not have the time nor resources to learn the subtleties of each sport they enjoy, and an effective broadcaster enhances the viewing experience by bridging that gap. Also, fans are smart. At the time I am writing this, the Formula 1 video linked above has 146,000 views just five days after the video was posted. There is an appetite for understanding sports beyond the surface.
Tony Romo’s commentary lends insight into what a quarterback sees on the field. Yet when broadcasting golf, commentators babble about players’ friends on Tour instead of explaining the difficulty of particular shots or why certain players will perform well on certain holes.
By turning on a game, fans are signaling a willingness to dedicate time to experience the product. What kind of signal is being sent back?
Quick Follow Up – Mickelson on #9
Last week, I wrote that Hole #9 at this past weekend’s Travelers Championship should set up well for Phil Mickelson due to how the shape of the hole aligns with the pattern of his tee shots. The data is in!
Phil played poorly all week, but he outperformed his competitors by almost +0.4 strokes per round on Hole #9, which was his second best hole of the tournament. Not bad!
Contact/Feedback
Email: Joseph.LaMagnaGolf@gmail.com
Twitter: @JosephLaMagna
Other Content I Enjoyed this Week
22-year-old Nelly Korda won the KPMG Women’s PGA Championship to become the top-ranked female golfer in the world:


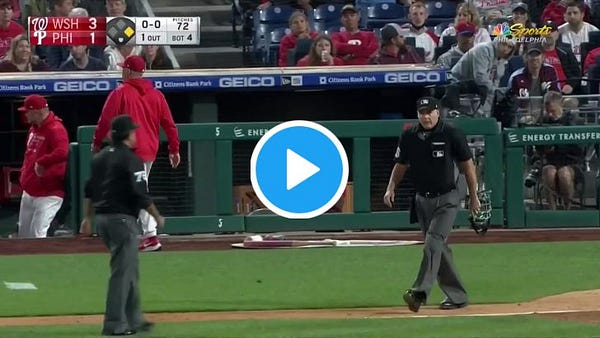
The MLB has started checking pitchers for using banned sticky substances. Pitchers are not pleased:


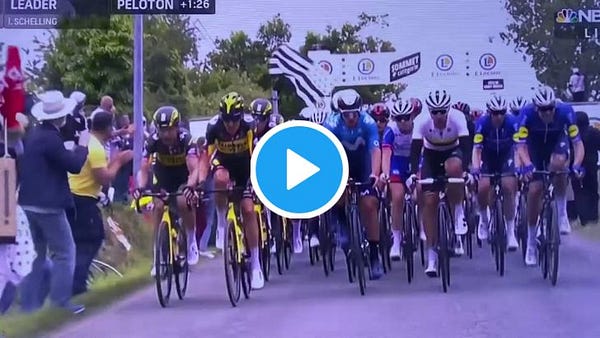
Fans keep putting a damper on major sporting events:
Interesting article on how television ratings can be misleading


